Description
Modeling Procedure
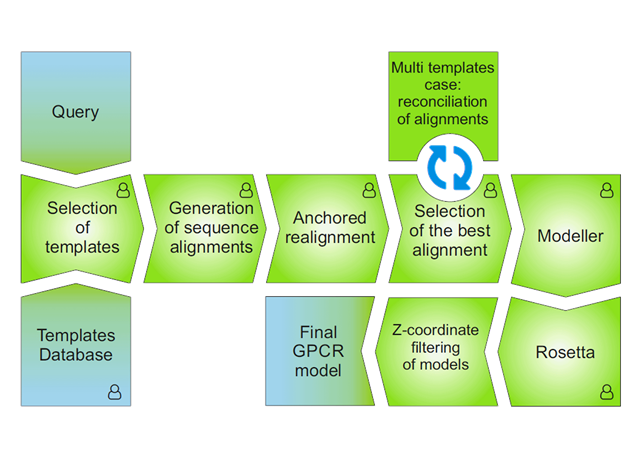
Fig. 1 The modeling procedure pipeline in GPCRM.
Selection of templates
The selection of templates is based on sequence similarity between query and templates calculated using multiple sequence alignment of a query sequence and all GPCRs sequences whose 3D structures are available in PDB. In the current version of the service we used a set of templates structures presented in the Templates section. If you mark the lysozyme option, then during modeling a set of templates is narrowed to those which has lysozyme version.
We used here three, in most cases correlated scores: clustalw2 score, normalized sequence identity and normalized sequence similarity. Automatically, if clustalw2 score is above 40% only one template is used for the model building. Otherwise, if clustalw2 score drops below 40%, two top-scored templates structures are selected to build a GPCR model of a query. Both alignments are merged before they are used for the model building.
Selection of models mode
Models mode: Long path - loops are extensively sampled by Rosetta (thousands of loops built, long computation time), Quick path - fewer loops are generated by Rosetta which allows to shorten the computation time while keeping quality of results on average, High similarity - generation of novel loops by Rosetta is omitted. The loops are taken from templates or generated by Modeller if missing.
Generation of sequence alignment
Three methods of sequence alignment generation are used:
- alignment of query and template sequence profiles (L. Rychlewski et al., Protein Sci. 2000, 9(2), 232-241)
- multiple sequence alignment of a query sequence and all GPCRs sequences whose 3D structures are available in PDB
- a simple query-template sequence alignment
In all above methods, MUSCLE – a program for generation of sequence alignments (R. Edgar, BMC Bioinfo. 2004, 5(1), 113) is used. For every query-template sequence alignment a sequence global similarity and sequence identity score is computed and the best alignment is chosen.
Original aligning methods will not give always a proper alignment of all GPCRs sequence motifs and introduce gaps inside TM helices. To solve this problem, GPCRM performs an automatic adjustment of the alignment generated by each method (anchored realignment) which prevent misaligning of important functional motifs of GPCRs and occurrence of gaps (longer than 1 residue) inside the TM helices.
In rare cases, when no consensus between sequence alignments of multiple templates can be found, the 'structure-based' consensus method is used. Here, the best alignment of the most similar template is used to predict the location of TM helices. Then, remaining templates sequences are fitted based on the structural alignment of all GPCR templates available in PDB.
Model building
The GPCR model is built using the Modeller DOPE modeling method (M. Y. Shen et al., Protein Sci. 2006, 15(11), 2507-2524). During the model building, spatial restraints derived from template (or templates) are imposed, together with the simplified CHARMM force field components (N. Eswar et al., Curr. Protoc. Protein Sci. Chapter 2, 2007).
Loop refinement
Loops derived from the alignment are refined with two methods:
- by Modeller the DOPE loop-modeling method is used here;
- by Rosetta - the fragment-based algorithm is used here, named: cyclic coordinate descent (CCD) (C. Wang et al., J. Mol. Biol. 2007, 373, 503-19).
Loop-modeling performed by either Modeller or Rosetta originally do not involve information about location of a protein with respect to the membrane. Consequently, some long loops and especially N and C-termini can be falsely introduced inside the membrane during the modeling. Such loop models are filtered out according to the information about the location of a template structure in membrane derived from the OPM database (M. A. Lomize et al., NAR 2012, 40(D1): D370–D37).
Model assessment
GPCRM provides as a result 10 best protein models which are the top-scored models according to the below energy terms:
- the Modeller DOPE score (either of the model itself or of the refined loops). The DOPE score is based on knowledge-based potentials derived from the PDB database of known protein structures
- the Rosetta Total score which is computed for an all-atom GPCR model (C. A. Rohl et al., Methods in Enzymology 2004, 383:66-93)
Main Form
| Username |
Maximum numbers of characters: 100. It is optional. |
| E-mail address | It is optional. We suggest to type your e-mail address here. The link to your results will be sent to you. |
| Query description |
Maximum numbers of characters: 1000. It is optional. |
| Query sequence |
Allowed format: fasta or plain sequence. Maximum length of sequence file: 10000 (including name tag and comments; we tested sequences of GPCRs at most 600 amino acids long). A fasta/plain sequence is restricted to single letter basic amino acid code without gaps and disambiguations (ACDEFGHIKLMNPQRSTVWY). Sequences after stop codon (*) are omitted. A sequence could be provided with fasta header (line starting with >). In the case of long loop insertions the performance of the method could be weaker – see Modeling Procedure. |
| S-S bridge |
To improve accuracy of the alignment and model building provide the suggested disulfide bridge between the extracellular loop 2 and the trans-membrane helix III. Cys1 – sequence id of cysteine in a TM helix 3 Cys2 – sequence id of cysteine in a EC2 loop Do not provide other disulfide bridges here. The field safely can be left empty. |
| Task mode | Auto – all steps of the modeling procedure (see Modeling Procedure) are processed without any User's intervention. Advanced – a User can change: subset of templates used in the modeling (first step) and the query-templates alignment and loops which are remodeled (second step). |
| Set of templates | We provide 2 subset of templates: PDB structures bound to agonists (named: active) and PDB structures bound to inverse agonists or antagonists (named: inactive). |
| Lysozyme | If the template, chosen for the model building contain a lysozyme it will introduced in the final query model in the same place as in the template. Instead, submitting query sequence with lysozyme sequence inside will give a less accurate lysozyme fold so it is not adviced in the current version of the service. |
| Rosetta loop-modeling | Loops present in the model can be remodeled by Rosetta loop-modeling protocole (see Modeling Procedure). |
| Show BLAST options |
Branch cutoff – cutoff used for similarity of sequences in the same clade of dendrogram constructed from the BLAST output. The bigger cutoff, the less similar sequences are used for the profile construction. Min e-value – Minimal E-value used in in the BLAST search. Max e-value – Maximal E-value used in in the BLAST search. More details of the BLAST program usage at: http://blast.ncbi.nlm.nih.gov |
Auto Mode
Results section:
| Submission info |
Data submitted to the GPCRM server. You can access the website with results using the Task token number: https://gpcrm.biomodellab.eu/result/Task_token_number/ |
| Template selection |
A table describing similarity between the query and templates sequences. We provide 3 assessment functions: ClustalW2 score – normalized sequence identity as defined at ClustalW2 website: http://www.ebi.ac.uk/Tools/msa/clustalw2/ Identity – sequence identity, for identical sequences you will get 100. Global Similarity - sequence similarity normalized to 1, calculated using BLOSUM62 substitution matrix. All the scores were calculated based on multiple sequence alignment of all GPCRs available in PDB with the query sequence. Pairwise alignments extracted from the multiple sequence alignment are available for view and download in the fasta format. In the View window important functional motifs and disulfide bridges are indicated. Templates selected as the best are indicated. |
|
Alignments generated with selected templates |
Here, final alignments between query and templates sequence are provided. Three methods for the query-template alignment generation are used: profile-profile alignment (profile-profile SA), multiple sequence alignment (multiple SA) with all GPCRs available in PDB and a simple query-template sequence alignment (pairwise SA). All alignments are generated using MUSCLE. |
|
Final Alignment in the PIR format |
The alignment provided in this section is the final alignment used in the model building procedure. The alignment is provided in the PIR format, as it is the format used by Modeller. For detail description of the PIR format see: http://salilab.org/modeller/manual/node473.html. |
| Loops to be modelled | Residues span of loops between TM helices refined by Modeller and/or Rosetta. |
| Generated Modeller Models | GPCR models generated by Modeller – optionally to download. |
| Generated Rosetta Models |
GPCR models generated by Rosetta.
Three energy terms are provided to assess models:
|
| Sequences in the query profile | You can download all protein sequences used to construct the sequence profile of the query. The first sequence in the alignment file is your query sequence. Sequences are not aligned. |
|
Anchored realignment - a log file |
A log file of anchored realignment of query and templates sequences with information about alignment of GPCRs sequence motifs and occurrence of gaps inside the TM helices. |
| Modeller run script (1) | A main python script used for running Modeller (model.py). |
| Modeller run script (2) | A python script used to define loops for Modeller (myloop.py). |
| Modeller Run - a log file | A log file from the Modeller run. |
| Rosetta Run - a log file | A log file from the Rosetta run. |
| Alignments & Models - zip file | A zip file with all the results in a one bundle. |
Advanced Mode
The job will be run in 4 steps. A user can change input data in every step to improve the modeling results. After introducing changes the 'Next' button should be pressed to proceed to the next step.
Step 1:
| Submission info |
Data submitted to the GPCRM server. You can access the website with results using the Task token number: https://gpcrm.biomodellab.eu/result/Task_token_number/ |
| Template selection |
A table describing similarity between the query and templates sequences.
We provide 3 assessment functions: ClustalW2 score – normalized sequence identity as defined at ClustalW2 website: http://www.ebi.ac.uk/Tools/msa/clustalw2/. Identity – sequence identity, for identical sequences you will get 100. Global Similarity – sequence similarity normalized to 1, calculated using BLOSUM62 substitution matrix. All the scores were calculated based on multiple sequence alignment of all GPCRs available in PDB with the query sequence. Pairwise alignments extracted from the multiple sequence alignment are available for view and download in the fasta format. In the View window important functional motifs and disulfide bridges are indicated. Templates selected as the best are indicated. You can change the templates set used for the modeling. There is no maximum number of templates you can use, however we advice not to use more than two templates per query – details are described in the paper of P. Larsson et al., Protein Sci. (2008), Vol. 17, 990–1002. |
Step 2:
| Submission info |
Data submitted to the GPCRM server. You can access the website with results using the Task token number: https://gpcrm.biomodellab.eu/result/Task_token_number/ |
|
Alignments generated with selected templates |
Here, final alignments between query and templates sequence are provided. Three methods for the query-template alignment generation are used: profile-profile alignment (profile-profile SA), multiple sequence alignment (multiple SA) with all GPCRs available in PDB and a simple query-template sequence alignment (pairwise SA). All alignments are generated using MUSCLE. You can change the alignment method used for the modeling by selection in the last column. |
Step 3:
| Submission info |
Data submitted to the GPCRM server. You can access the website with results using the Task token number: https://gpcrm.biomodellab.eu/result/Task_token_number/ |
|
Final Alignment in the PIR format |
The alignment provided in this section is the final alignment used in the model building procedure. The alignment is provided in the PIR format, as it is the format used by Modeller. For detail description of the PIR format see: http://salilab.org/modeller/manual/node473.html. |
| Loops to be refined |
Loop span residues (loop starting residue; loop ending residue). Loops between TM helices shown in this field are refined by Modeller and optionally by Rosetta.
Only the loops which are maximum 20 amino acids long are shown in this field. The longer loops are detected automatically and refined only by Rosetta but not by Modeller.
You can change the loop residues numbers provided you maintain the csv format, e.g.:
1;9
You may also delete all loops and leave the field completely empty. |
Step 4:
The same as in Auto mode - see Auto mode for details.